Table of contents
1. Benefit from an improved handling of information for not yet randomized patients
2. Benefit from an improved user experience
3. Acquire information on the forecasted CO2e emissions of your trial supply chain
1. Benefit from an improved handling of information for not yet randomized patients
Previously, missing patient group (PG) and strata values for not yet randomized patients had to be manually assigned to patients or matched to default values which was time-consuming. Moreover, empty fields caused matching errors preventing the Monitoring dashboard from opening, initial state from being created and simulations from running.
With this Supply.2023.6 version, PG and stratum information are handled as optional information in the IRT data extract and the initial state setup which eliminates the need for manual assignments or matching, saving time and ensuring the system is not blocked by the missing information.
1.1. Trials with one single PG or stratum
When importing the IRT data extract in the Supply App, if there is one single value for the PG or the stratum in the Trial master data, the missing information is automatically assigned to this PG or stratum in the extract. The automatic assignment in case of one single value is applied to all patients (randomized or not yet randomized).
As a consequence, the extract does not contain errors linked to missing information and all subsequent functionalities can be used properly.
1.2. Trials with several PGs or strata
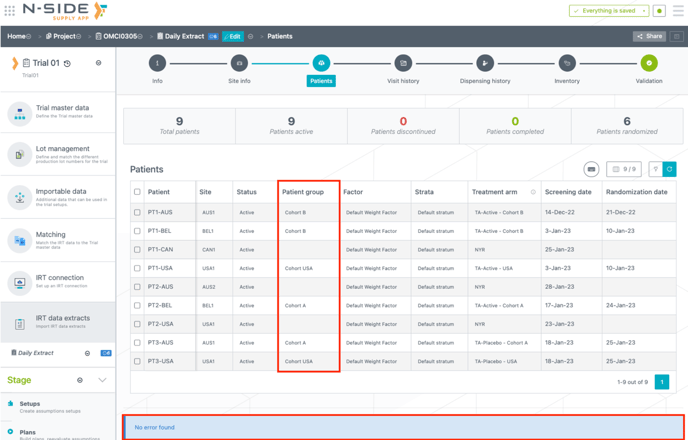
When importing the IRT data extract in the Supply App, in case of multiple values for the PG or the stratum, the missing information (for patients that are not yet randomized) is left empty in the extract. As PG and the stratum values are not mandatory for not yet randomized patients anymore, the extract will not generate errors from those empty fields (see image below).
1.2.1. Impact on reevaluations of setups
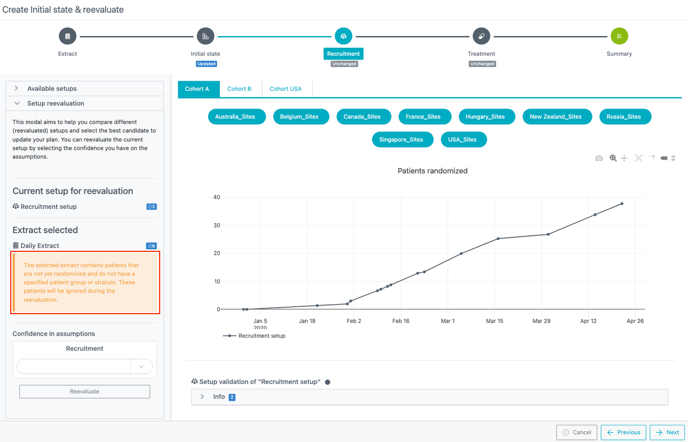
For trials with multiple PG or strata, patients with missing information in the extract are ignored in the reevaluation computation. A warning message is displayed in the setup reevaluation window (see image below).
Recruitment setup reevaluation:
-
A delay in the reevaluated recruitment will be observed if not yet randomized patients are ignored from the computation (as it results in an underestimation of the number of patients screened).
Good practice: Avoid reevaluating the recruitment in that case or manually take into account the patients excluded from the computations.
Treatment setup reevaluation
-
The reevaluated screening failure will decrease as screen failed patients without PG/stratum are ignored while the number of actuals increases.
-
If needed, the screening failure can be computed manually.
2. Benefit from an improved user experience
2.1. Enjoy an improved user interface when browsing trials
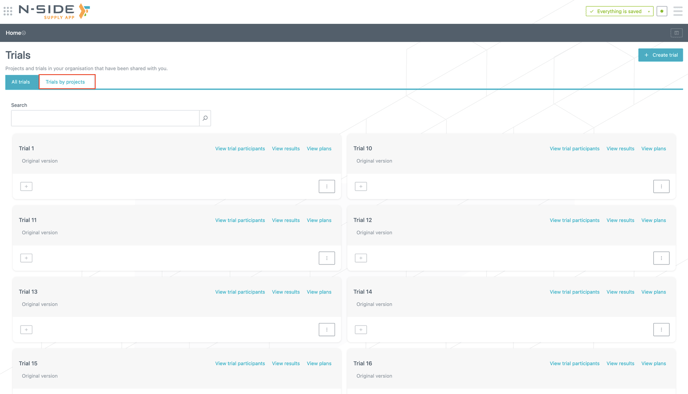
You can now access all trials in one single place.
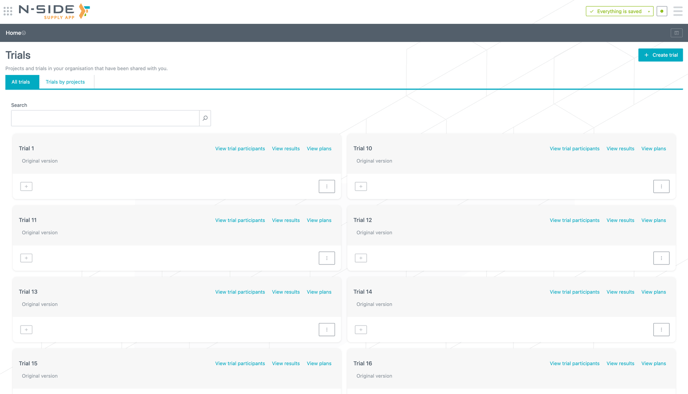
You can search for trials with the added search bar (see animation below). The corresponding trials names are displayed as soon as you start typing.
You now have a direct access to the results and plans of the trial directly from the trial card (see image below).
If needed, you can still access the view where trials are organized by projects by clicking on "Trials by project" (see image below).
2.2. Categorize and identify your trials with labels
2.2.1. Status and therapeutic area
You can now define a "status" and a "therapeutic area" per trial in order to categorize trials and identify them in the Trials view.
Statuses and therapeutic areas are defined in the "Projects" tab of the Master data where generic values have been automatically generated and integrated with the release of Supply.2023.6. (see image below).

Status and therapeutic area are assigned to trials in the "Trials" table in the Master data (see image below). 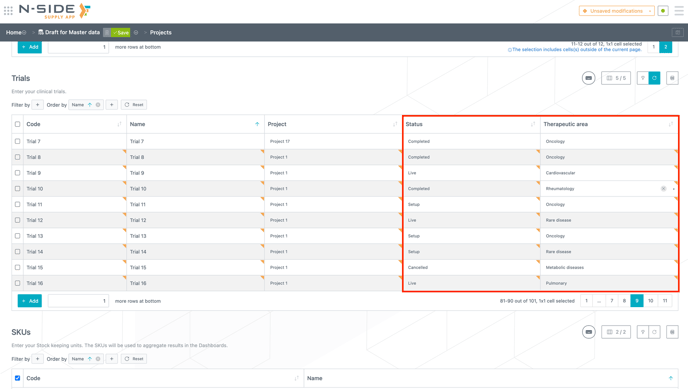
No status or therapeutic area is assigned to a trial by default. Only Corporate users can create, edit and delete a status and/or therapeutic area.
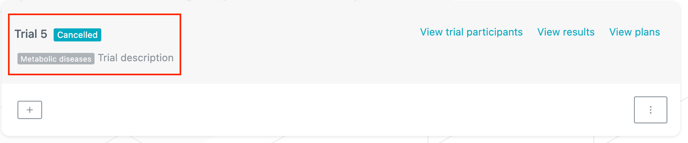
In the "Trials" view, status and therapeutic area are displayed with a colored background in the upper section of a trial card. The status is displayed next to the trial name and therapeutic area is displayed below (see image below).
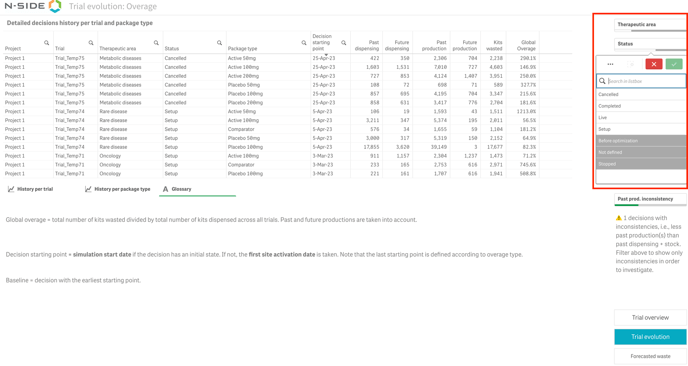
You can also visualize and filter trials using the status or the therapeutic area in the Global performance dashboard (see image below).
2.2.2. Custom labels
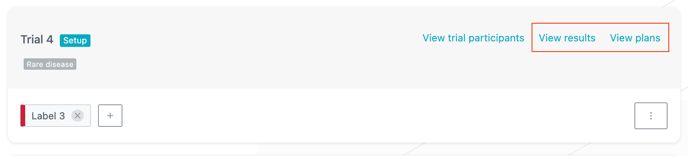
Beside statuses and therapeutic areas, you can also create and assign custom labels to any trial to further categorize your trials.
Custom labels can be created (or removed) directly from the trial card. To add a custom label to a trial, click on the + button and select the label from the drop-down menu. If the label is new, type in the name of the label and the system will create it (see visual below).
2.3. Launch a simulation directly from the plan card
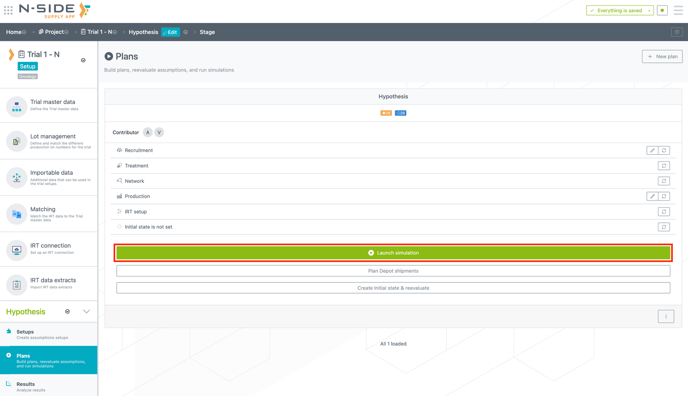
From now on, you can launch a simulation directly from the plan card using the newly added button (see image below). However, you can do this only if the plan is up to date and contains no error.
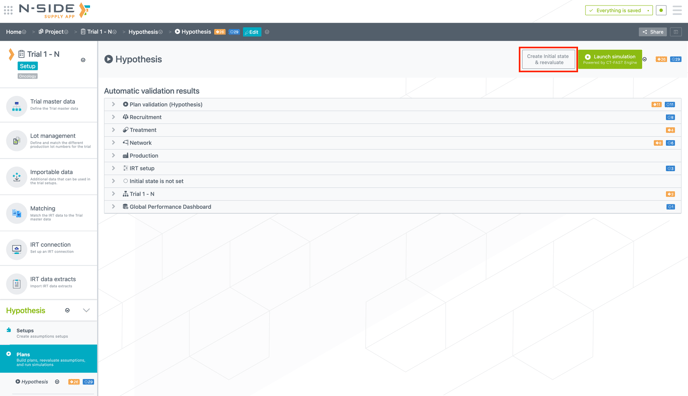
To access a plan details, you now have to simply click on the plan card. From this view, you can now create an initial state and reevaluate your plan (see image below).
2.4. Benefit from more functionalities to manage your results
2.4.1. Filter and order your results
You can now filter and order your results with the same functionalities as in the other tables (see image below). Notably, you can filter/order the results based on the creation (or update) date.
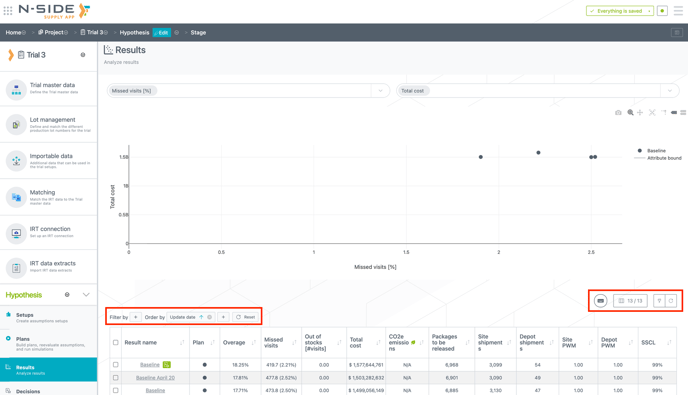
Moreover, you can now also directly visualize the number of depot shipments in the table
2.4.2. Delete multiple results at once
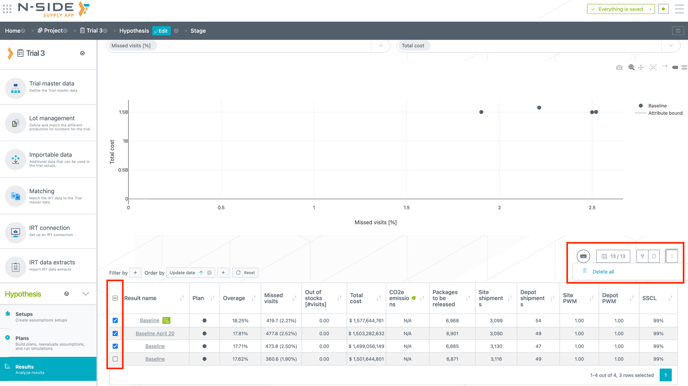
You are now able to select all or several results to delete them at once (see image below).
2.4.3. Copy/paste relevant information from the table
You can now select multiple cells from the table and copy/paste them in an Excel file (see video below). Simply highlight the cells and use the keyboard command cmd + C (or ctrl+C on Windows) to copy them.
2.4.4. Access a redesigned detailed view for a result
By simply clicking on a result name in the table, you access a redesigned detailed view where you can still access different dashboards, download the Results report and take a new decision for this result (see image below).

3. Get information on the forecasted CO2e emissions of your trial supply chain
You are now able to consider CO2e emissions (CO2 equivalent emissions) as an input to forecast the environmental footprint of productions and shipments for each trial.
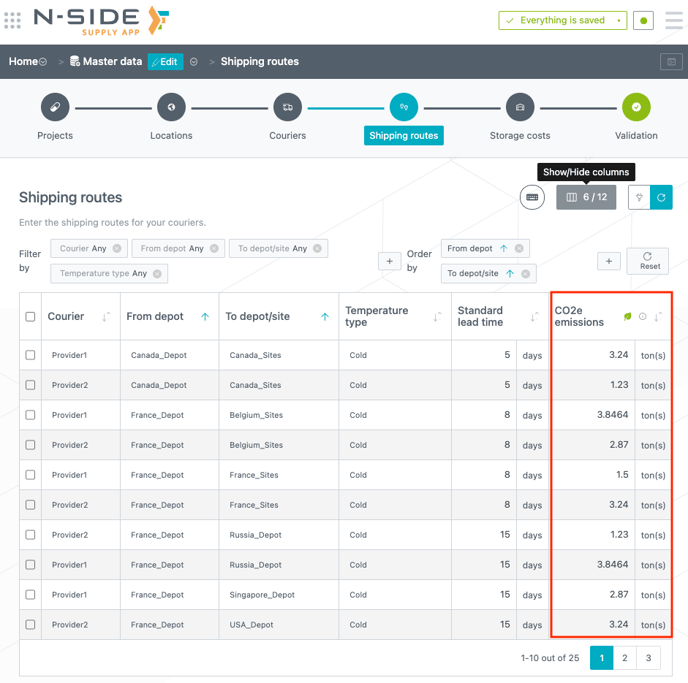
3.1. Input CO2e values in the Supply App
You can enter CO2e emission values for shipping routes (see image below) and SKUs ("Projects" tab) in the Master data. As SKUs can be linked to products at trial level those emissions can include many steps of the production process: DS, DP, packaging, etc.
3.2. Analyze forecasted CO2e emissions per trial
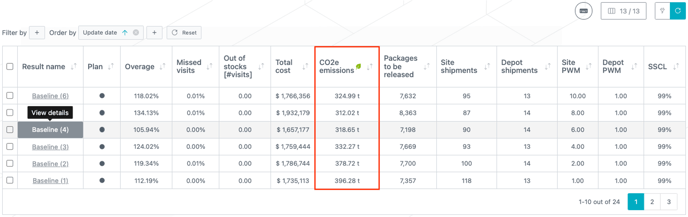
Once entered in the Master data, those CO2e emission values are then used to compute the forecasted emissions of a trial.
The shipping routes and SKUs CO2e emissions used are summed to obtain the total CO2e emissions that are displayed in the results table (see image below).
4. Other updates
4.1. Download the XML file used to generate an IRT extract data set
You can retrieve and download the latest .XML file used to generate an IRT data extract data set directly from the data set in the Supply App (see video below).
4.2. Usability improvements
-
Duplicating a plan in a new stage will not duplicate the initial state anymore and depot shipment tables will be emptied.
-
When taking a decision on a result, the next reevaluation date is not mandatory anymore.
-
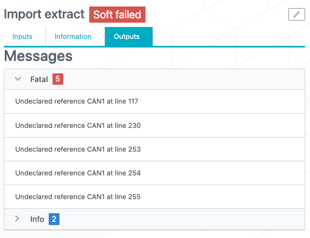
In case an IRT data extract import failed due to "undeclared references", you now have visibility on these faulty references in the job outputs (see image below).
5. Bug fixes
The following issues are now fixed:
- Depot resupply levels were too low for some models with multiple temperature types and are now adjusted. A slight decrease in site shipments and a minor increase in optimized quantities and overage could be observed.
-
Randomization and dispensing values in the Monitoring dashboard were inaccurate when the extract date was more than 6 months away from simulation start date.
-
Computation has been adapted to display the right forecasted values regardless of the time gap between the simulation start date and the extract date.
-
- Monitoring dashboard dispensing values were inaccurate (or missing) when the related plan did not have an initial state.
- Accurate forecasted values are now displayed even if the plan does not have an initial state.
- Incorrect quantities were displayed in the past production inconsistencies warning message at result level. This was leading to some discrepancies with the correct computations displayed in the reporting tools.
- The warning message is now aligned with the reporting tools, comparing package types (from the initial state) with package types (from the past productions).
-
An error was preventing the definition of different skipped visit rates per patient group.
6. User documentation
The following articles are added (or have been modified) to enrich the documentation and help you in your usage of the N-SIDE Supply App: