This release mainly focuses on local depot inventory monitoring, delivering detailed forecasts, proactive alerts, and storage capacity insights for enhanced risk management and operational efficiency.
1 - Key Features Highlights
2 - Monitor local depot inventories in monitoring dashboard
3 - View on future inventories level (for local depot inventories) in Excel results report
4 - Local depot and sites - Storage capacity
1 - Key Features Highlights
-
Monitoring of Local Depot Inventories: New dashboard view compares min/avg/max forecasts with IRT actuals, featuring alerts and detailed lot breakdowns for proactive risk management.
-
View on Future Inventory Levels: Weekly min/avg/max forecasted inventory level for local depots
-
Storage Capacity: Monthly min/avg/max estimates for simultaneous kit storage at depots and sites (expired kits excluded), aiding warehouse planning in Excel reports and Results Dashboard.
2 - Monitor local depot inventories in monitoring dashboard
A new view is available in the Monitoring Dashboard to compare local depot inventory forecasts (minimum, average, and maximum) with current stock from the IRT data extract.
This view integrates two data types for effective comparison and supports proactive management of inventory levels.
Forecasted inventory:
-
Computed based on the selected simulation results used to generate the dashboard.
-
Covers the period from the simulation start date to 6 months later.
-
Split into minimum, average, and maximum estimated inventory levels, updated week by week.
-
Kits are excluded from the forecast once they reach their "worst-case Do-Not-Ship (DNS)" date (this DNS is calculated using the longest lead time from the depot to any supplied location).
-
Actual Inventory from IRT data extract:
-
Derived from the IRT data extract, providing a snapshot of the current inventory at the location.
-
Kits are categorized by status:
-
Available: Kits physically at the location and shippable to all downstream supplied locations.
-
In-Transit: Kits en route from suppliers but not yet at the location.
-
Out of DNS: Kits physically at the location but past their DNS date (calculated based on the longest lead time to supplied locations). These are no longer considered shippable and are differentiated from available kits
-
-
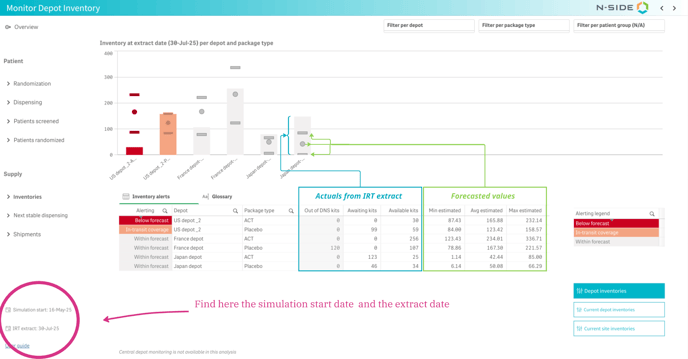
Two views are available: Overview and Detailed View.
Overview
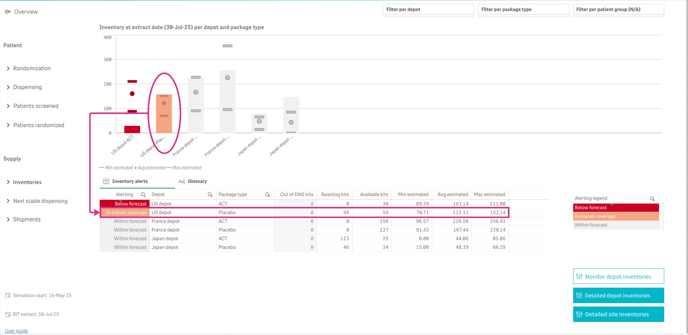
This view provides a summary of the current status at local depots as of the extract date. It compares actual stock levels (by depot and package type) against the min/avg/max forecasts from the simulation.
-
Alerting Levels (Highlighted for Each Depot-Package Type Pair):
-
Within Forecast: Available kits are sufficient to meet or exceed the minimum forecast (available kits ≥ min estimated).
-
In-Transit Coverage: Available + in-transit kits are sufficient to meet or exceed the minimum forecast(available + in-transit kits ≥ min estimated).
-
Below Forecast: Available + in-transit kits are not sufficient to meet the minimum forecast (available + in-transit kits < min estimated).
-
-
Table Details: Offers an expanded view of inventory levels, split by available, in-transit, and out-of-DNS kits (the latter are excluded from forecasts and alerting computation).
-
Navigation: Click a depot-package type pair in the chart to open the Detailed View for that selection.
Detailed View
Detailed view show the inventory evolution for the selected Depot-Package type couple (orange and green lines) and compare it to the current inventory level in the data extract (blue bar)
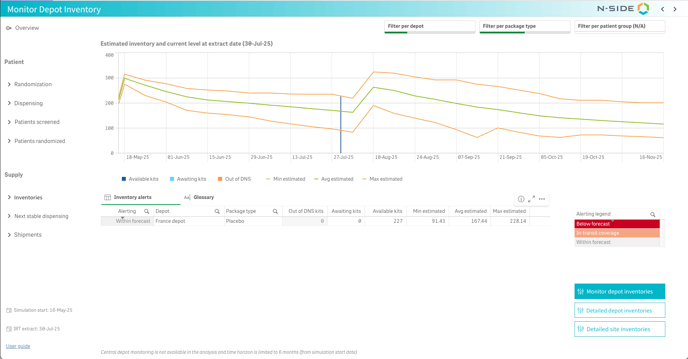
This view shows the forecasted inventory evolution from the simulation start date to 6 months later, including min/avg/max values. At the extract date, a bar displays current stock with color splits for available, in-transit, and out-of-DNS kits.
-
Interpreting Forecasted Lines: Certain patterns indicate specific events.
-
Upward Parallel Trends (all three lines rising together): Indicates a planned or optimized depot shipment in the depot shipment planning.
-
Downward Trends: Indicates kits leaving the inventory, either due to shipments to supplied locations or entry into DNS.
-
Limitations and Points of Attention
-
Scope: Not available for central depots. If a depot functions as central for one temperature type and local for another, only data for the local temperature type is displayed.
-
Exclusions from chart: Depot-package type pairs with zero forecasted inventory (min/avg/max) over the next 6 months are hidden.
-
Worst-Case DNS: Calculated using the longest lead time to supplied locations. In rare cases (e.g., a depot supplying another depot that supplies sites, plus direct site supplies), this may result in an overly conservative DNS.
-
Kits in Transit: In some IRT systems, kits are marked as in-transit only when physically en route. This may make it appear as if a shipment was not generated (based on encoded lead times in the network setup), even if it was planned but not yet visible.
-
Compatibility: Requires results generated in Supply Suite 2025.3 or later.
Best Practices
-
Avoid relying on forecasts from results that include risk, as they may underestimate actual inventory needs.
-
Monitor inventory levels alongside recruitment and dispensing data for full context.
-
For red alerts, investigate thoroughly before acting - the DNS may be conservative. Check if out-of-DNS kits are still viable for sites with short lead times, or verify if an upcoming shipment was generated (it may not yet show as in-transit, depending on the IRT provider).
3 - View on future inventories level (for local depot inventories) in Excel results report
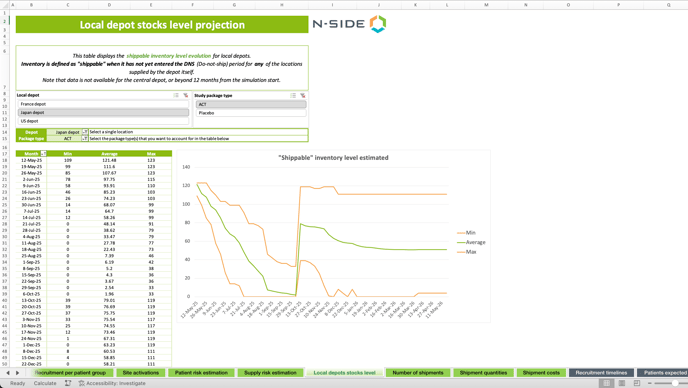
Local depot - stock level projection
This table displays the shippable inventory level evolution for local depots.
Inventory is defined as "shippable" when it has not yet entered the DNS (Do-not-ship) period for any of the locations supplied by the depot itself.
Note that data is not available for the central depot, or beyond 12 months from the simulation start.
Those are the same values as the one displayed in the monitoring dashboard inventory forecast.
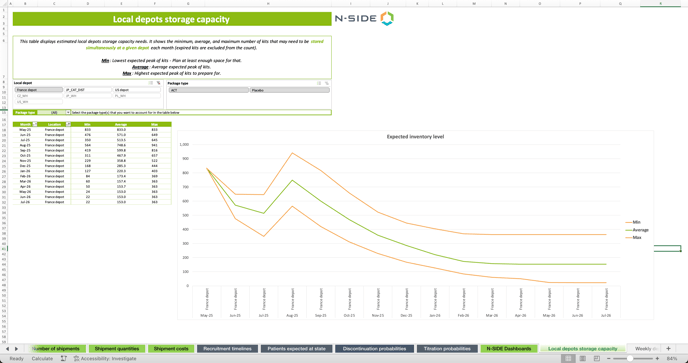
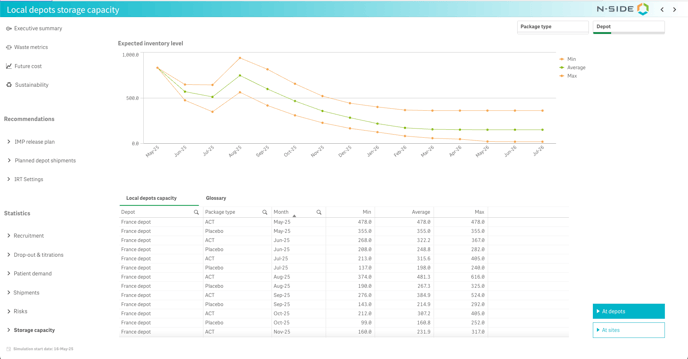
4 - Local depot and sites - Storage capacity
This table displays estimated local depots storage capacity needs. It shows the minimum, average, and maximum number of kits that may need to be stored simultaneously at a given depot each month (expired kits are excluded from the count).
Min: Lowest expected peak of kits - Plan at least enough space for that.
Average: Average expected peak of kits.
Max: Highest expected peak of kits to prepare for.
In Result dashboard
In Excel results report
This is an hidden tab